Unlock exclusive perks with a Collaborative Response Membership and dive into a treasure trove of resources—from on-demand webinar recordings and customizable templates to timetable overviews, student support strategies, and a rich video library!
Get 1 month FREE
Student data and evidence helps to inform the collaborative conversation, flagging students to collectively focus upon, as well as shine a light upon evidence to guide professional learning, shifts in educational practice and impact of student supports being utilized.
Access a number of resources and samples below, organized by a variety of topics related to the effective organization and use of data and evidence to inform Collaborative Response practices.
Reflection Tools
The following tools can be used to reflect upon your structures and processes related to Data and Evidence, as well as collect evidence to determine growth and impact over time.
| Reflecting on Data and Evidence (School-Based) - Template - Template to reflect on considerations related to the effective use of data and evidence at the school level to inform responses for students and direction for teams |


Universal Screens
Also referred to as benchmark assessments, universal screens are administered to all students school-wide, as part of a clearly articulated assessment plan (which also includes the use of diagnostic and progress monitoring assessments). Administered one to three times annually, the actionable data produced by universal screens serve to flag students for collaborative conversation.
Samples
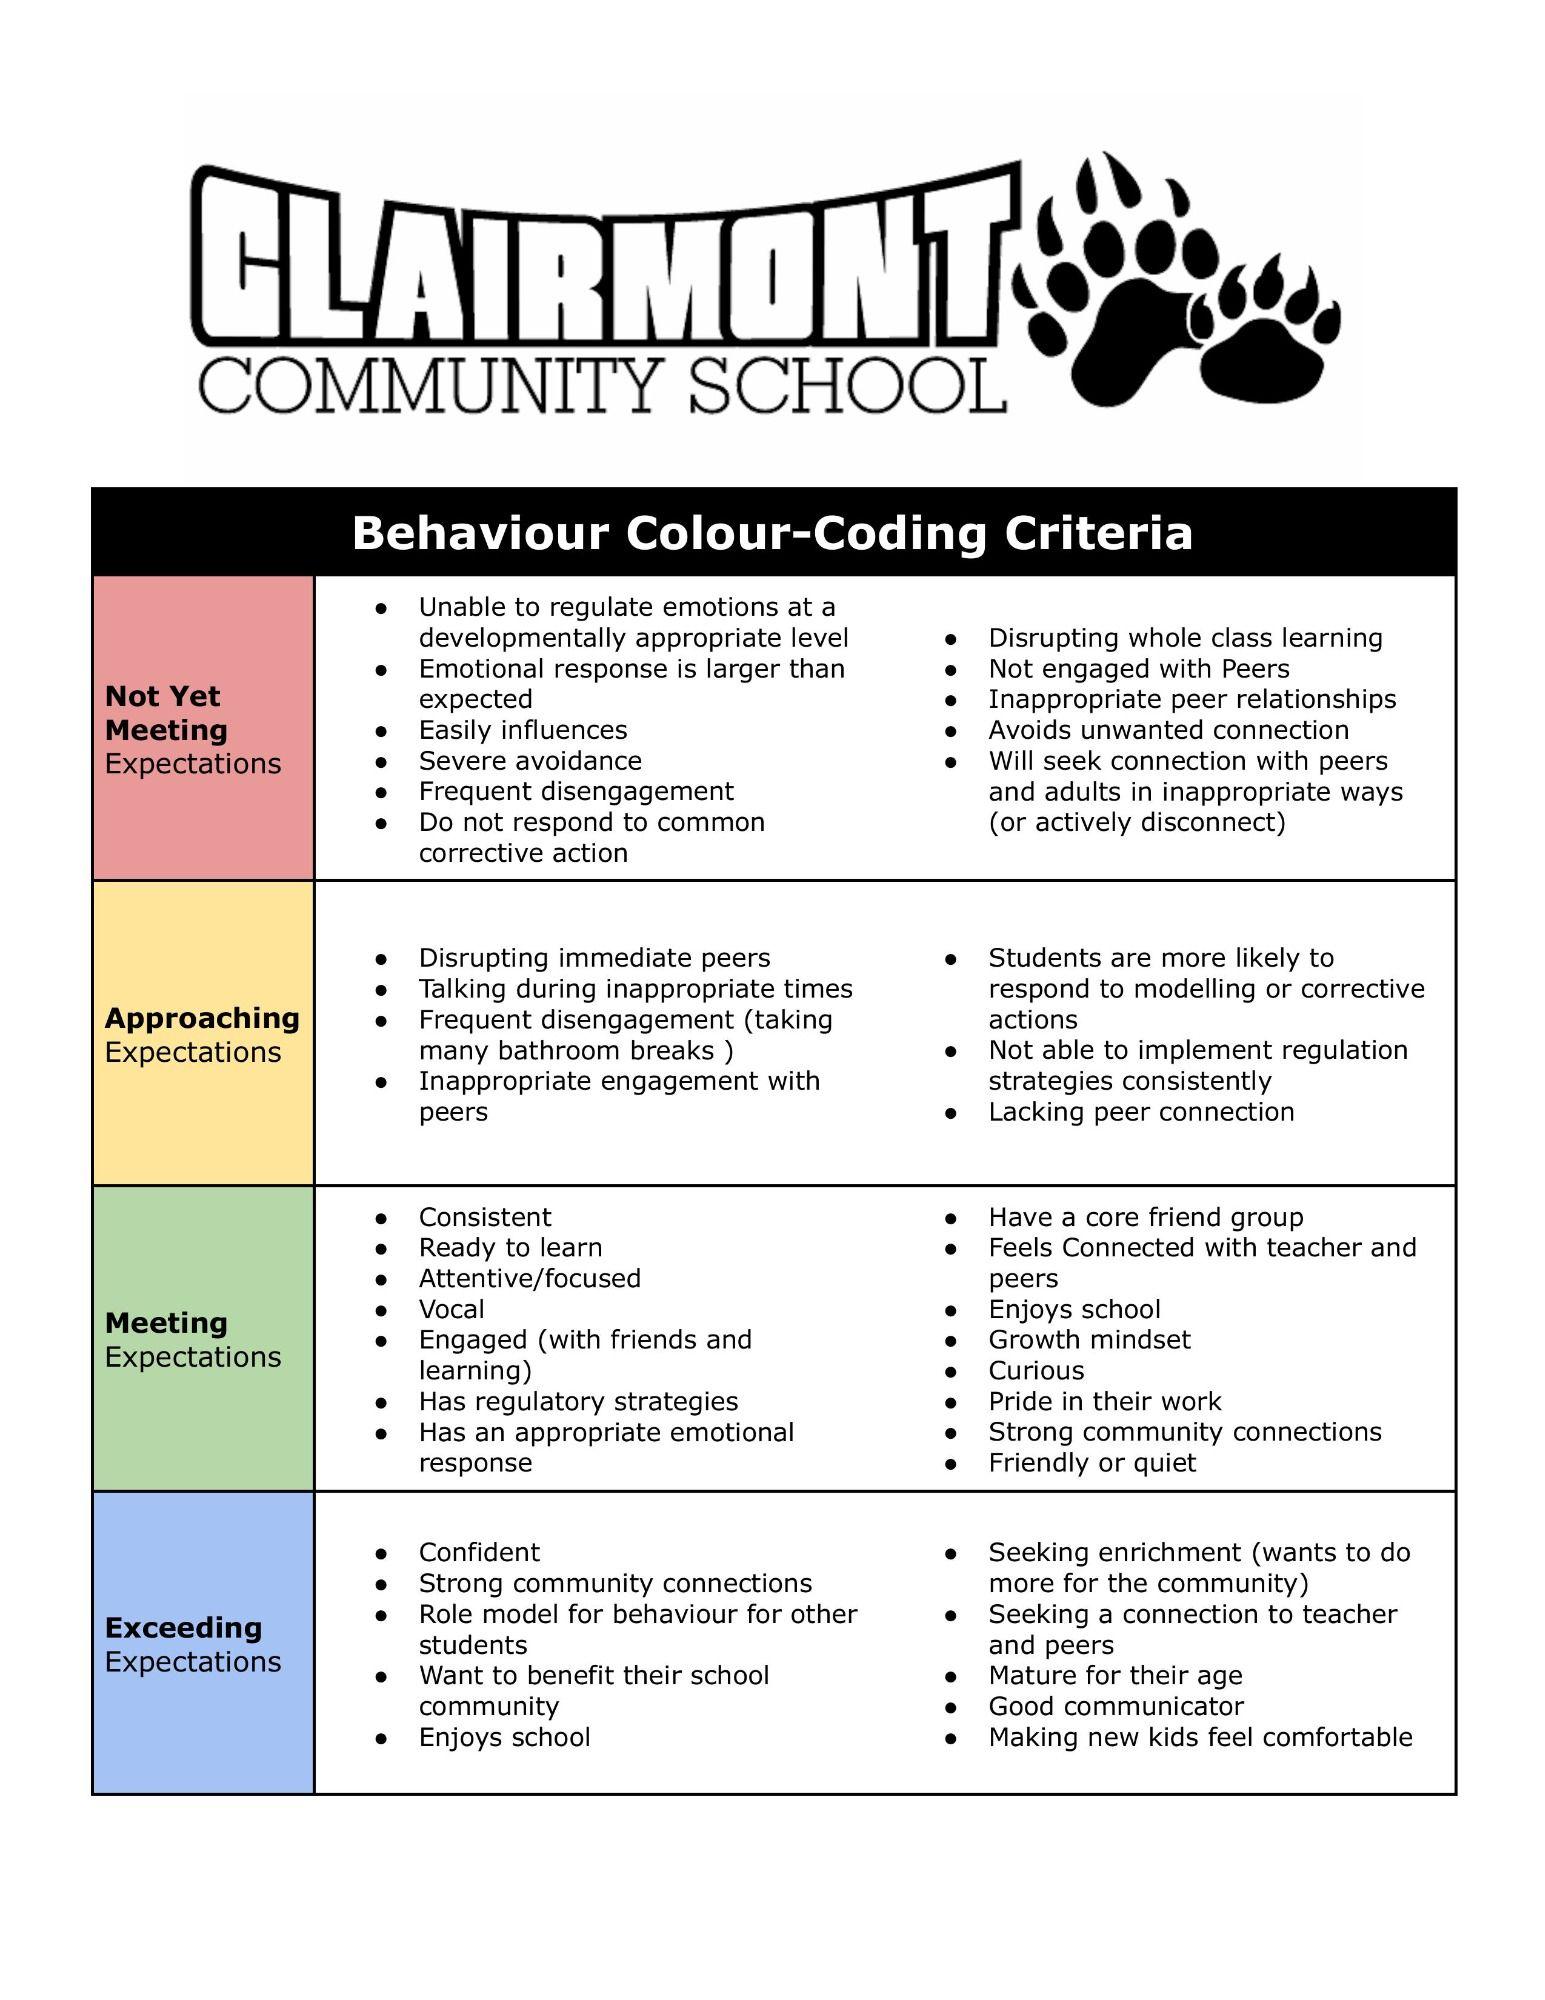 | Behaviour Data Criteria - criteria established at Clairmont Community School to establish a colour-coded data set for behaviour, informed by teacher observations and interactions. Copyright 2026, J. Ware - Clairmont Community School, Peace Wapiti Public School Division, AB. Shared with permission. |
 | Executive Functioning Student Survey - developed by Helen E Taylor School Copyright 2024, C. Young - Helen E. Taylor School, Peace Wapiti Public School Division, AB. Shared with permission. |
| Prescott Learning Centre Year End Transition - Google form used by teachers to record key class information data, to assist in transitioning students into the next grade. Copyright 2024, K. Lam - Prescott Learning Center, Parkland School Division, AB. Shared with permission. |
| Potential Benchmarks/Screening Tools - A collection of potential benchmarks/screening tools for consideration, that are being used and accessed by schools. |
| View additional universal screen samples contributed by our partners |

How you organize data for your teams matters! Without a thoughtful plan for how the data is organized to be accessed by teams, we can be wasting valuable time and resources!
In this free on-demand webinar, you will learn:
- Why the organization of data should be a number one priority for leaders
- 5 mistakes leaders make when organizing data…and more importantly, how to correct those mistakes
Access Webinar

Scheduling
Scheduling for universal screen administration, analysis and response is important at the school and/or district level, ensuring strategic collection of data to guide responses for individuals, cohorts and whole school populations. Universal screen data not only informs team meeting discussions, but can also identify trends and provide evidence of growth across a school or system.
Samples
| Queen Elizabeth School - Data and Evidence Sequence - overview sharing the sequencing of screens, diagnostic and progress monitoring assessments, as well as the purpose of each. Copyright 2022, C. Kirwin - Queen Elizabeth School, Wetaskiwin Regional Public Schools. Shared with permission. |
| View additional scheduling samples contributed by our partners |


Mark Twain once said, “Data is like garbage. You’d better know what you’re going to do with it before you collect it!!”
Data informs! When schools have a targeted plan for the collection and utilization of data and evidence related to student success, conversations become more focused and staff can see the impact their collective practices are having for students!
In this on-demand workshop, Kurtis will share ten considerations, along with templates and samples for school leaders to assist when establishing a school-wide data and evidence plan, focused on the key measures being used to inform priority areas.
Entry Level Criteria
Student entry level criteria helps to determine a common understanding of the level students are entering a grade level in a specific area of focus. It is intended to utilize a simple colour system and once established, the entry level criteria can be used to:
- Determine colours on student cards in WeCollab
- Determine which students should be focused on when planning supports and/or classroom instruction
- Support transition meetings as students move from grade to grade
- Used by other grade levels to determine targets to be aiming for when planning forward
Data Overviews
Data overviews are essential when moving to data and evidence being used to flag specific students to discuss at Collaborative Team Meetings, as well as ensure information from key measures is visually accessible for teams. Simple colour coding criteria, including all students in a cohort, organized by key measure result and infusion of a key issue related to each key measure for individual students are all important elements to consider when constructing data overview templates.
Samples
 | Lochearn - RCAT Literacy Data Overview - data overview, with colour-coding, for key literacy screener to support team planning and response for individual students. Copyright 2024, L. Brown - Lochearn Elementary School, Wild Rose School Division, AB. Shared with permission. |
| Ecole Providence Data Overview - this simple data overview uses colour-coding to show student progression over three benchmark dates, as well as progress for students. Copyright 2024, A. Sharpe - Ecole Providence School, Holy Family Catholic Regional Division. Shared with permission. |
| Woodhaven Student Data Overview - Data overview template developed by a middle school to track literacy, numeracy and social-emotional key measures, that includes colour-coding criteria and space for identifying key issues for students. Copyright 2023, N. Dickson - Woodhaven School, Parkland School Division. Shared with permission. |
| Primary School Data Overview - Sample literacy data overview from a primary school, organizing two reading benchmark data sets (student names removed). |
 | MIPI Data Overview - Sample numeracy data overview from a K-9 school, organizing students by overall screening score with infusion of key issues (student names removed). |
 | Priority Indicators Overview - contributed by Holy Spirit Catholic School Division Copyright 2022, A. Skretting - Holy Spirit Catholic School Division, AB. Shared with permission |
| View additional data overview samples contributed by our partners |


In this Leading Collaborative Response podcast episode, Kurtis shares 5 mistakes leaders make when organizing data and tips to impact how data is organized effectively in overviews for teams.
Access Episode
Data Analysis
Analyzing data as a team requires a clear process to help determine trends and gaps for students, both individually and globally, to help inform responses. Through the identification of strengths and areas in need of support, data analysis should inform next steps across classrooms, across the school and across an entire system, as well as flag students in need of further support and potentially to be brought forward to Collaborative Team Meetings to surface key issues for examination.
